


1. Version Control
Version control in the Business Intelligence world has never really been a thing, at least in my experience. In 2021, Google came out with a, somewhat rudimentary, version control feature in Looker. Although basic, it helps a ton when working with larger reports that need constant, lengthy updates.
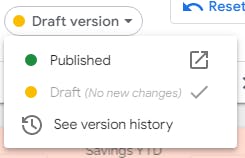
You can enable 'publishing' in Looker and switch between Draft vs. Published versions; allowing you to work on your report without the end user seeing it live.
To enable:
Edit Mode
File -> Publishing Settings
Once enabled, this will appear at the top of your report:
2. Parameters
Parameters in Looker are similar to parameters in Tableau. Parameters allow dynamic input by the user, allowing real time computations. You can also pass parameter inputs back to custom SQL. Allowing a query like:
SELECT [parameter_to_select]
FROM myBigQuerytable
LIMIT 1;
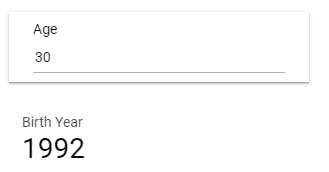
Another example of the dynamic power of parameters is using Age as an input from the end user. Given the input, you can then do custom calculations, like displaying that person's birth year.
Parameter Setup:
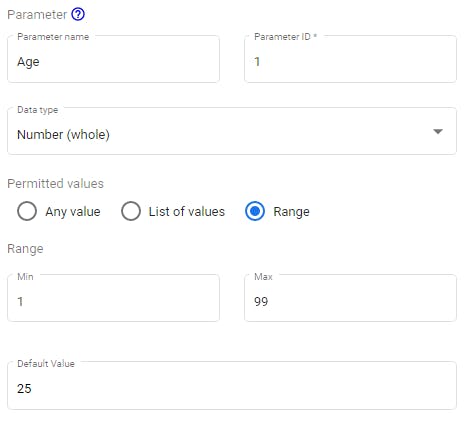
Birth Year calculation: DATETIME_SUB(today(),INTERVAl Age YEAR)
User Input and Birth Year Calculated:
3. Page & Report Level Filters
Ever found yourself endlessly applying filters to each scorecard or table on a page? Well you can create a page OR report level filter and by default, it's applied universally to all report or page objects.
Page Level:
Page -> Current Page Settings -> Add a Filter
Report Level:
File -> Report Settings -> Add a Filter
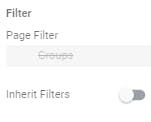
If there are a few objects you don't want the higher level filter applied to, you can choose not to inherit that filter under that object's data properties.
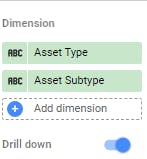
4. Drill Down Metrics
Visualizing hierarchically related dimensions can be tricky. GDS offers a drill down option for related dimensions. Take an Asset Type dimension and an Assest SubType. When properly set up, the end user can drill deeper into hierarchical dimensions.
5. Align Page Objects
Right click while selecting 2 or more objects on the page and align them either vertically or horizontally. For instance, this option in the screenshot below will snap the two tables vertically in line with each other (based on the middle marker of each visual)
This makes formatting scorecards, tables and visualizations incredibly easy. No more dragging a millimeter here, a millimeter there.